
Musings
Hypermiling Case Study
Hypermiling Case Study
There are many ways to look at the cost analysis for the fuel data I kept from March 3, 2007 - March 8, 2008. But before I break down three different solutions, if you care to read no further, the overall conclusion is that for my 2003 Pontiac Vibe with manual transmission and front wheel drive, I spent ~$300 less in fuel over the course of a year by practicing the hypermiling techniques I discussed in my previous musing.
Data Gathering
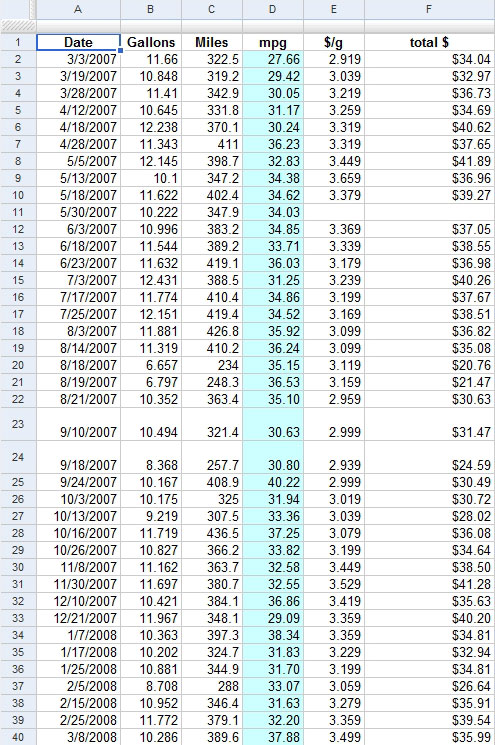
For each trip to the pump (39 total) between March 2007 and March 2008 I recorded the date of the fill up, the number of gallons refilled, the number of miles driven on the tank, the cost per gallon, and the overall cost of the purchase. From the miles driven and the amount of gallons purchased, I calcuated the miles per gallon (mpg) achieved on that tank. The raw data is provided below. In one visit to the pump, the cost per gallon and total purchase price were not recorded. However, this does not significantly alter any general results. There do not appear to be any statistically significant outliers and the standard deviation of 1.328 allowed me to confidently retain all data points.
For each trip to the pump (39 total) between March 2007 and March 2008 I recorded the date of the fill up, the number of gallons refilled, the number of miles driven on the tank, the cost per gallon, and the overall cost of the purchase. From the miles driven and the amount of gallons purchased, I calcuated the miles per gallon (mpg) achieved on that tank. The raw data is provided below. In one visit to the pump, the cost per gallon and total purchase price were not recorded. However, this does not significantly alter any general results. There do not appear to be any statistically significant outliers and the standard deviation of 1.328 allowed me to confidently retain all data points.
Key Summary Data
Given an estimated pre-hypermiling average mpg of 27, several key averages and constants were calculated and are supplied below.
Given an estimated pre-hypermiling average mpg of 27, several key averages and constants were calculated and are supplied below.
| Constants: | |
| Pre-hypermiling average mpg: | 27 |
| Number of fill-ups in a year: | 39 |
| Tank volume (gallons): | 12.5 |
| Total miles driven in a year: | 14,056 |
| Averages: | |
| Hypermiling average mpg: | 33.53 |
| Average cost per gallon: | $3.22 |
| Avearge fill-up (gallons): | 10.747 |
| Average miles driven per tank: | 360.4 |
| Average cost per mile hypermiling: | $0.094 |
| Average cost per mile pre-hypermiling: | $0.116 |
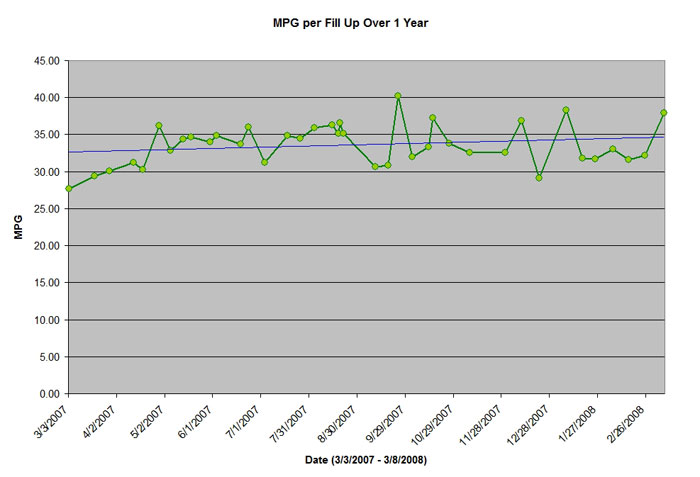
Before proceeding into the cost analysis, there are a few general points to be made. Plotted below is each fill up's mpg over the course of a year. Even though the overall hypermiling average mpg was 33.53, it is important to note the general upward trend in mpg (blue trend line). Throughout the whole year, my car's mpg performance steadily improved. By the end of the study, my average mpg was just under 35.
During the course of this study the car was primarly driven in a temperate climate. While central coast California can see fairly extreme temperatures, annual temperatures tend to range from the 40s to the 60s. Even given the lack of major seasonality, there appears to be a slight indicator of seasonal effect on mpg performance. During the spring and summer months my mpg performance consistently hovered near 35. During the winter months my mpg performance was much more erratic with much larger swings in variability. I suspect a car driven in a less temperate environment would see even more pronounced seasonality effects.
Cost Analysis
Cost per Mile
For each data point (fill up) the cost per mile was calcuated by dividing the miles driven on that tank by the total purchase price. The average cost per mile over the whole data set is $0.094. Driving a total of 14,056 miles over the course of the study, the total cost comes out to be $1,322.54.
Now lets suppose I was not hypermiling. I adusted the mpg data column to be constant 27. This subsequently effected (reduced) the number of miles driven on each tank. Because the cost of each fill up does not change, the cost per mile on each tank increases. The total purchase price for each tank was divided by the non-hypermiling number of miles driven on each tank. The average cost per mile, not hypermiling, over the whole data set is $0.116. Assuming I still drove 14,056 miles on the year, the total cost comes out to be $1,635.22. The difference between the two total costs is $312.68. Hypermiling saved me ~ $300!
On another note, holding the number of fill ups constant at 39 and using the non-hypermiling mpg of 27, I'd only have grossed 11,317 miles on the year. The difference of total miles driven for the same total cost for hypermiling vs. not hypermiling is 2,739 miles! Hypermiling affored me an additional 2,700 miles at the same cost!
Trips to the Pump
I filled up my tank 39 times from March to March and drove a total of 14,056 miles. Suppose a pre-hypermiling mpg of 27 and an average fill up of 10.747 gallons. To drive a total of 14,056 miles on the year I would have had to visit the pump 48 times. That's 9 more trips to the pump. From March to March the average cost per gallon was $3.224. At 10.747 gallons per fill up, that's an extra $311 spent in those 9 extra fill ups! Hypermiling saved me ~ $300!
I filled up my tank 39 times from March to March and drove a total of 14,056 miles. Suppose a pre-hypermiling mpg of 27 and an average fill up of 10.747 gallons. To drive a total of 14,056 miles on the year I would have had to visit the pump 48 times. That's 9 more trips to the pump. From March to March the average cost per gallon was $3.224. At 10.747 gallons per fill up, that's an extra $311 spent in those 9 extra fill ups! Hypermiling saved me ~ $300!
Difference per Fill Up
While hypermiling over the course of a year I averaged 360.4 miles driven per tank. Overall, my average fill up was 10.747 gallons. Assuming a pre-hypermiling mpg of 27 and keeping the fill up volume constant at 10.747 gallons, I would only average 290.2 miles on a tank. This is a difference of 70.2 miles. Hypermiling affords me an additional 70 miles per tank. Still assuming 27 mpg, this 70.2 mile difference equates to a difference of 2.6 gallons per fill up. Over the course of a year (39 fill ups) this adds up to 101.4 extra gallons. At an average cost of $3.22/gallon, that's $327.06! Hypermiling saved me ~ $300!
While hypermiling over the course of a year I averaged 360.4 miles driven per tank. Overall, my average fill up was 10.747 gallons. Assuming a pre-hypermiling mpg of 27 and keeping the fill up volume constant at 10.747 gallons, I would only average 290.2 miles on a tank. This is a difference of 70.2 miles. Hypermiling affords me an additional 70 miles per tank. Still assuming 27 mpg, this 70.2 mile difference equates to a difference of 2.6 gallons per fill up. Over the course of a year (39 fill ups) this adds up to 101.4 extra gallons. At an average cost of $3.22/gallon, that's $327.06! Hypermiling saved me ~ $300!
Conclusion
No matter how you look at the data, the bottom line is I saved over $300 over the course of a year by hypermiling. That works out to ~ $25/mo or ~$6/week. Hypermiling is like a small pay raise ... and its tax free!
No matter how you look at the data, the bottom line is I saved over $300 over the course of a year by hypermiling. That works out to ~ $25/mo or ~$6/week. Hypermiling is like a small pay raise ... and its tax free!
Another thing to note is the average cost of gallon of gas for the year that I took data, $3.224, is really a thing of the past. Fuel prices around here are now well over $4.00/gallon. As the cost of gas continues to increase, the savings realized from hypermiling will be even more gratifying.
Notes
These data are all specific to my 2003 manual transmission, front wheel drive, Pontiac Vibe. My driving conditions were a mix of city and highway and driving conditions were not discriminated. Other data will vary based upon vehicle, driving style, driving conditions, climate, and local cost of fuel. These data are meant as a guideline and are presented to simply be convincing, not an undeniable truth, as there are far too many factors that were not controlled.
These data are all specific to my 2003 manual transmission, front wheel drive, Pontiac Vibe. My driving conditions were a mix of city and highway and driving conditions were not discriminated. Other data will vary based upon vehicle, driving style, driving conditions, climate, and local cost of fuel. These data are meant as a guideline and are presented to simply be convincing, not an undeniable truth, as there are far too many factors that were not controlled.